EXECUTIVE SUMMARY
As a progressive employer who believes equality is one of the key pillars of a successful business, we are pleased to once again report against the annual requirements of the Equality Act 2010 (Gender Pay Gap Information) Regulations 2017.
In our ninth year of reporting we have reported a mixed set of results over the years, however we are pleased the results for this year show once again a negative gender pay gap for both mean and median pay. We continue to ensure we have female representation in the Senior Management Team, 25% for 2025.
The proportion of each gender in quartile pay bands is skewed as only 12% of the workforce are female, however when we look at dispersion of each gender across the same pay quartiles it shows a significantly different picture:
| Quartile | Lower | Lower middle | Upper middle | Upper |
| Female | 36.7% | 3.3% | 16.7% | 43.3% |
| Male | 23.7% | 27.9% | 26.0% | 22.3% |
DECLARATION
I hereby confirm that the information provided in this report to be accurate.
Gary McEwan
CEO
3rd January 2026
INTRODUCTION
Interfloor Limited is no longer required by law to carry out Gender Pay Reporting under the Equality Act 2010 (Gender Pay Gap Information) Regulations 2017, but have chosen to submit voluntarily. We are a progressive employer who believes fairness in all we do is one of the core foundations to our business approach.
The reporting requirement involves carrying out six calculations that show the difference between the average earnings of men and women in our organisation. We can use these results to assess:
The challenge for Interfloor and across the UK is to eliminate any gender pay gap.
GENDER PAY GAP CALCULATIONS
1. The Mean Gender Pay Gap
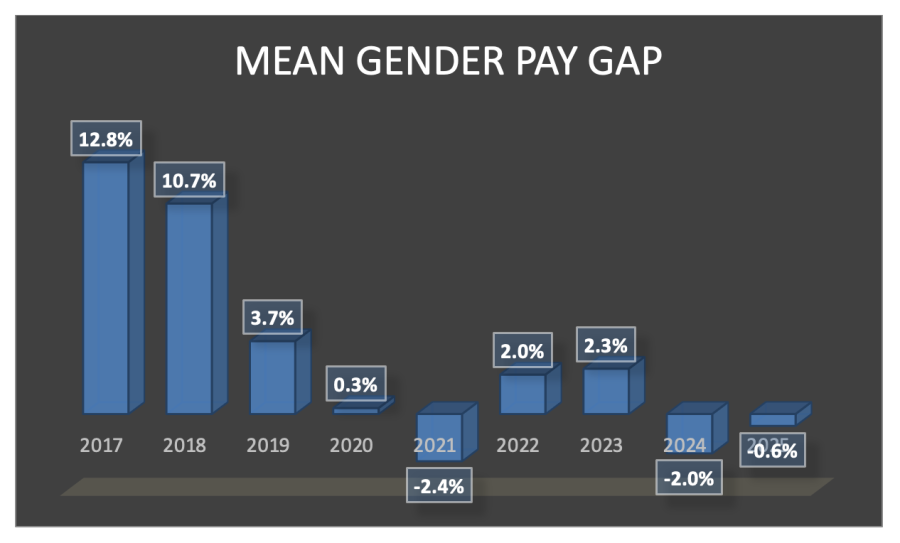
After showing a significant year on year improvement over the first 5 years of reporting resulting in a gap in favour of females by 2021, the situation unfortunately worsened a little over the next 2 years however has again improved in both 2024 and in 2025. This decrease in our Gender Pay Gap has been driven by significant performance related wage increases for some female managers. Our efforts to ensure we recruit female representation in middle and senior management roles also helps, and female representation makes up 25% of our Senior Management Team.
Mean averages are useful because they place the same value on every number they use, giving a good overall indication of the gender pay gap, but very large or small pay rates can dominate and distort the answer.
Our analysis of comparable roles shows that we reward men and women fairly for similar work.
2. The Median Gender Pay Gap

Despite losing a little ground in 2020 we have shown significant year on year improvement reducing from 11.1% in 2017 to now -9.0% in 2025.
Median averages are useful to indicate what the ‘typical’ situation is i.e. in the middle of an organisation and are not distorted by very large or small pay rates.
3. The Mean Bonus Gender Pay Gap

Whilst this can be a good measure where bonus payments are common across an organisation, large or small bonus payments can dominate and distort the answer where such payments are not prevalent across the business. This is the case for Interfloor as bonus schemes are limited to Senior Management as well as UK and International Sales functions which make up less than 10% of the workforce.
4. The Median Bonus Gender Pay Gap
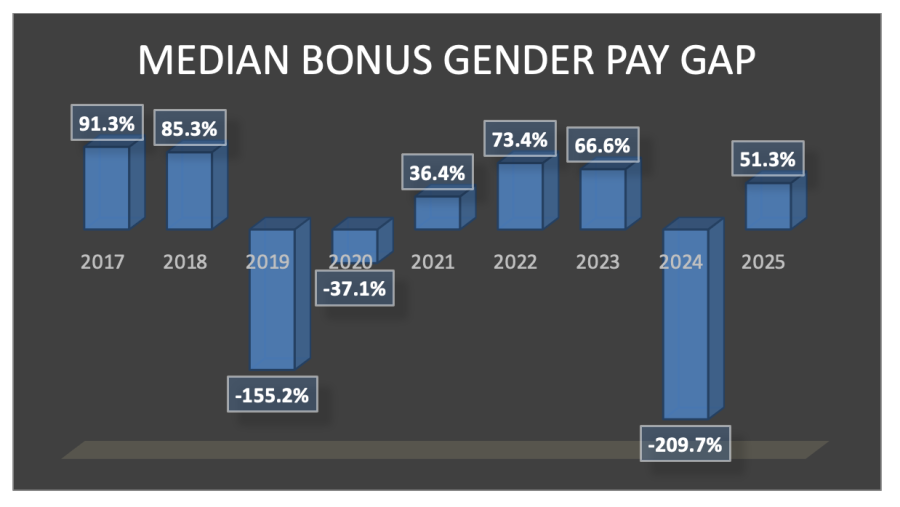
The median bonus gender pay similar to the mean gap above is distorted by a very small number of employees receiving a bonus.
5. The Proportion of Males & Females Receiving a Bonus Payment
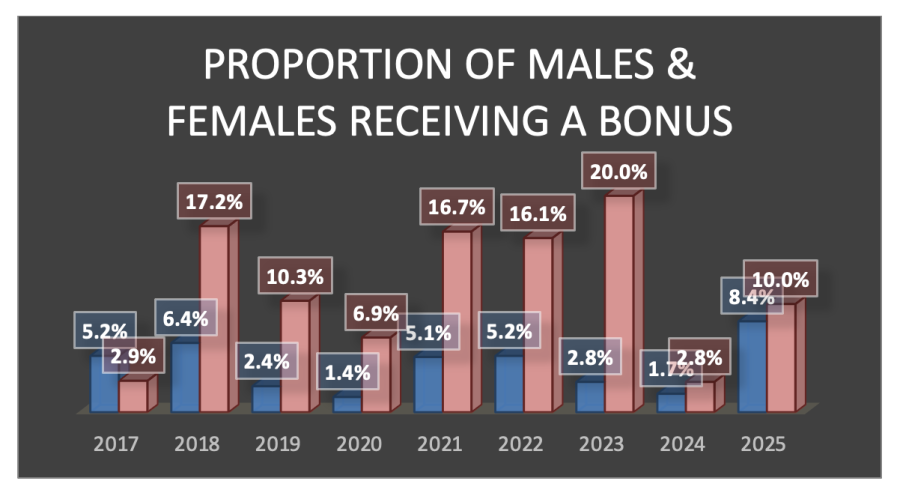
As achievement of bonus payments is based on various business performance metrics, the number of employees receiving a bonus was less than 10% of the workfoce. 10% of female employees received a bonus compared to 8.4% of male employees.
6. The Proportion of Males & Females in Each Quartile Pay Band
The proportion of each gender in quartile pay bands for April 2025 shows:
| Quartile | Lower | Lower middle | Upper middle | Upper |
| Female | 17.7% | 1.6% | 8.2% | 21.3% |
| Male | 82.3% | 98.4% | 91.8% | 78.7% |
As female employees only account for 12% of the workforce this can be partially misleading, the dispersion of each gender across the same pay quartiles shows:
| Quartile | Lower | Lower middle | Upper middle | Upper |
| Female | 36.7% | 3.3% | 16.7% | 43.3% |
| Male | 23.7% | 27.9% | 26.0% | 22.3% |
ACTION PLAN
Recruitment & Retention
Following the covid pandemic, introduction of IR35, Brexit and the current cost of living crisis which have all had a serious impact on the labour market; recruitment and retention has been extremely challenging over the last few years.
Unfortunately fewer women study and work in science, technology, engineering and maths [STEM] disciplines in the UK which form a large part of our organisation. In the medium to longer terms our aim is to recruit/develop more female employees into our operations focused functions as well as our Senior and Middle Management Teams. Significant progress has been made with 25% of the Senior Management Team and over 20% of the Middle Management Team now being female.
In order to achieve this aim we will continue to:
Pay Systems
In determining pay and reward for our employees we balance a number of factors, including the economic climate, company performance as well as external market for the roles that we offer. Whilst our reward systems have always ensured full compliance with equal pay, we continue to integrate gender pay gap considerations into future reviews of pay and reward.